
ASX Market Update 6th August 2026


Markets reach new heights
The S&P 500 delivered a strong 2.52% gain for the period, from 7,533 on 16 July to a fresh all-time closing high of 7,736 on 4 August (AEST: 5 August) — the 25th record close of 2026. The Nasdaq added 1.86%, though its path was far more turbulent: the index swung sharply within the period as big tech earnings delivered some spectacular beats and some painful disappointments, creating the most volatile earnings week since 2020.
The overriding story of the period was the big tech earnings season, covered in full in Section 2. Away from that, three macro forces shaped the market.
Key macro drivers:
• Iran uncertainty whipsawed oil and gold — The US resumed military pressure on Iran in mid-July after peace talks stalled, pushing WTI oil back above $90/bbl and sending gold to a six-week high above $4,300/oz. On 2 August (AEST), however, President Trump cancelled a planned strike after receiving Iranian signals about a deal. WTI fell 5.7% in a single session to US$75.77 — and the ASX surged on the news. As at 6 August, Trump described Iran as having given deal “perimeters” but Iran denied formal talks — a diplomatic back-and-forth that continues to drive day-to-day volatility in oil, gold, and energy stocks.
• Fed holds rates at July meeting — The Federal Reserve held its benchmark rate unchanged at 3.50–3.75% at its July 28-29 meeting (AEST: 29-30 July), as widely expected. Chair Kevin Warsh reiterated data-dependence and did not pre-commit to any path. The decision supported equities, though Warsh’s statement noted that inflation remains above target and the Fed retains the option to hike. CME FedWatch shows approximately 55% probability of a hike at the September meeting if June CPI (due 30 July AEST) surprises to the upside.
• Q2 US GDP printed at 1.8% annualised — US Q1 2026 GDP growth was revised down to 1.8% annualised (from 2.1%), the slowest pace in four quarters, reflecting the economic drag of elevated oil prices and the Iran conflict on consumer spending and business investment. While this cooled rate-hike fears somewhat, the economy's underlying consumer spending and private investment components remained solid — not weak enough to signal a recession, but softer than the pre-conflict trend.
• Earnings season dominated sentiment — With 305 of the S&P 500 companies having reported Q2 results, 86% have beaten on EPS and 68% on revenue. EPS growth is tracking at 57% — extraordinary by any historical measure. The S&P 500 Equal Weight Index outperformed the cap-weighted index in July by the largest margin on record, signalling a genuine broadening of the earnings recovery beyond just the mega-caps.

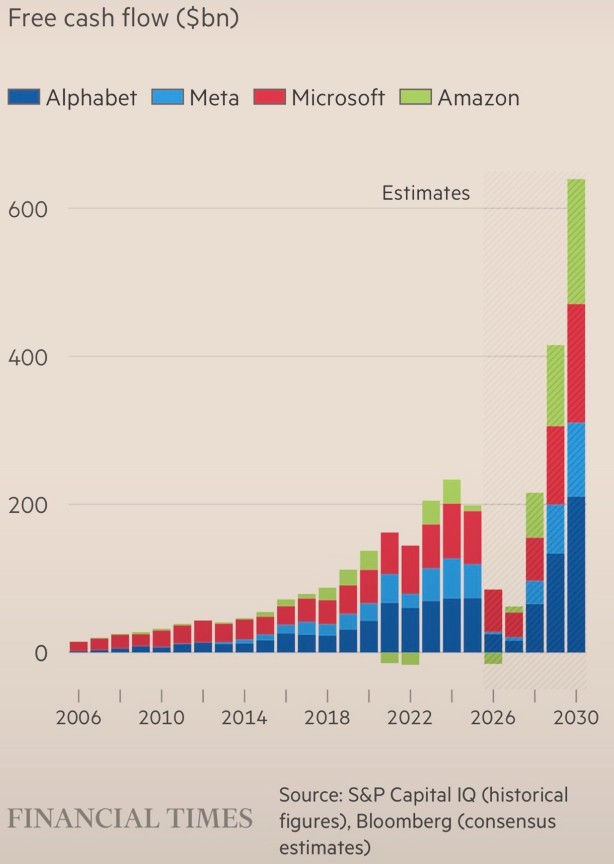
The Nasdaq’s choppier journey reflects the big-tech split: Alphabet’s and Meta’s capex shock sold off the index sharply mid-period, while Microsoft and Amazon’s strong results provided a recovery. Palantir’s extraordinary +29% move on 4 August (AEST) provided the final lift into the ATH. The market’s message is clear: AI is generating real revenue, but the capex bill is massive, and investors are increasingly focused on when that spending converts to free cash flow.
Our take: Not much more to add to the above except that what I spoke about a few weeks ago has played our nicely. My thoughts were that the fears of AI’s Capex spend, ROI & competition from Chinese open-source models will be gradually dismissed as earnings carried on. This seems to be the case as big tech has rebounded strongly. Earnings and commentary surrounding it have eased investor fears, and they have taken advantage of cheap valuations and bought aggressively. After the NVDA earnings report in 2 weeks, I can see the US markets settling down again until the mid-term elections are over and then performing strongly again in Q4. In a mid-term election year Q4 averages a +6.6% return and 12 months after the elections the S&P500 averages a 14-16% return.
The Iran situation continues to simmer in the background but seems to be of little concern to equity markets and oil prices. The Brent futures curve shows contract prices for January 27 at $75 for Brent today suggesting that it expects oil to ease further from here. There still seems to be enough oil to go around now and the belief by the market that the Hormuz straight will be re-opened again soon. I believe Aramco’s profit report this week also help relieve fears coming in well above expectations. Production showed 9.5mmboe/d in Q2 26 vs 12.8mmboe/d in Q2 25. A 3.3mmboe/d reduction but still shows Aramco can ship out 75% of pre-conflict oil production despite the straight being closed. Eventually I can see a world whereby only Iran and its allies use the straight and everyone else invest in new infrastructure to avoid it. In fact, it was reported mid-July that 7 addition pipelines were being invested in by Arab states to shift 60% of oil production out of the Hormuz straight by 2028. Markets always find a way!

The fortnight from 22 July to 5 August 2026 (AEST) delivered the most concentrated tech earnings period of the year. The headline: AI is generating extraordinary revenue growth — but the spending required to maintain that growth is making investors nervous. Here is the full scorecard.
Microsoft (MSFT) | Reported: 30 Jul 2026 (AEST) | Result: BEAT — Stock fell 7% |
Revenue: $81.3B (+17% YoY) vs $80.3B expected. Azure cloud grew 39%, the Intelligent Cloud segment hit $32.9B, and Microsoft Cloud crossed $50B in a single quarter for the first time. Commercial backlog grew 110% to $625B. The beat was unambiguous.
Alphabet (Google) (GOOG) | Reported: 23 Jul 2026 (AEST) | Result: BEAT — Stock fell 15% |
Revenue: $119.8B (+24% YoY) vs $116.9B expected. Google Cloud surged 82% to $24.8B, its fastest growth in years. Search revenue grew 17%, YouTube ads +13%. Operating income rose 30%. Net income of $112B was inflated by $98B in unrealised gains on its SpaceX stake.
Amazon (AMZN) | Reported: 31 Jul 2026 (AEST) | Result: BEAT — Stock jumped +10% |
Revenue: $200.6B (+20% YoY) vs $196.5B expected. EPS of $5.75 vs $1.82 expected — a remarkable beat, boosted by Anthropic investment gains. AWS grew 37% to $42.2B, its fastest pace in 18 quarters, with a $496B backlog growing triple-digits. Advertising revenue grew 26% to $19.8B. Operating income up 43%. CapEx raised to $220B for 2026.
Meta Platforms (META) | Reported: 30 Jul 2026 (AEST) | Result: MISS on EPS — Stock fell 10% |
Revenue: $60.8B (+28% YoY) vs $60.2B expected — slight beat. EPS: $6.18 vs $7.22 expected — a 14% miss. Advertising revenue grew 27% to $59.4B on 14% more impressions and 12% higher prices. Daily active people reached 3.6B. But total costs surged 55% to $42B, including $2.4B in legal charges and $1.18B in severance tied to 8,000 layoffs. Operating margin collapsed from 43% to 31%. Free cash flow fell to just $784M on CapEx of $31.1B.
SpaceX (SPCX) | Reported: 5 Aug 2026 (AEST) | Result: BEAT — Stock fell 5–8% |
SpaceX’s first earnings report since its June IPO. Revenue: $7.8B (+92% YoY) vs $6.72B expected. EPS loss of -$0.09 vs -$0.26 expected — a much narrower-than-feared loss. Starlink (Connectivity) grew 66% to $4.3B. AI revenue surged 247% to $2.6B. Space revenue grew 29% to $962M. 78 launches in the first half of 2026.
Palantir (PLTR) | Reported: 4 Aug 2026 (AEST) | Result: BEAT — Stock surged +12–29% |
Revenue: $1.94B (+93% YoY) vs $1.80B expected. EPS: $0.41 adj. vs $0.35 expected. US commercial revenue surged 149% to $764M — its fastest growth in company history. GAAP operating margin hit 47%. Net income of $1.07B. 2026 US commercial revenue guidance raised to "in excess of $3.42B" (from $3.22B). CEO Alex Karp: "Forget consensus."
Our take: With only NVDA left to wrap up the reporting season out of the big tech Q2 looks to be another stellar reporting season, one that has again surpassed most analysts’ wildest expectations. It again eased fears over AI capex spend, ROI and Chinese open-source models. I think the biggest takeaway came from PLTR which saw its US commercial division grow 149%. In the past most of its growth has come from Government contracts, but in Q2 this flipped. This shows real demand and ROI for what is a pure AI product/service. The growth in cloud demand continued to accelerate, across the board, in what can only be seen as demand for AI as well. We also got more granular comments from Amazon and SpaceX which said their payback for AI Infrastructure spend was less than 3yrs for AMZN and less than 1yr for SPCX. This is an incredible ROIC.
After the GOOG report we saw a genuine sell-off again due to spending fears as we saw GOOG enter negative FCF for the first time in history. Again, what I have mentioned above eased those fears again but also would like you to refer to the above chart which was shown to me by Anthony Doyle at Pinnacle. It shows an expected FCF boom in the coming years as margins from Ai token remain large and demand increases. It is expected we hit 130 quadrillion tokens per annum by 2030 vs the 5 quadrillion we see today. Costs per million tokens are expected to come down to less than $USD0.10 by the end of the year and will end up at the marginal costs to produce them in years ahead. Due to hyper demand and capacity constraints the hyperscalers can charge higher prices for them. Even with token prices charged likely to come down materially, due to the insatiable growth the FCF will still explode. Now we can see why big tech is happy to commit such large capex numbers to Ai infrastructure. Also, GOOG has a 25-year history of delivering on average +32% ROIC per annum. I would back them in just based on that to know what they are doing as they have seen many changes in their business model in that period.
I will still strongly back big tech here and still believe that the AI trade has a long way to go and will only spread to more companies. We are already seeing the benefits of it in construction, productivity and job creation. This doesn’t mean we wont have corrections ahead or challenges but I remain of the view these are buying opportunities.


Index movement
Index | 16 Jul 2026 | 6 Aug 2026 | Change (pts) | % Change |
S&P/ASX 200 (XJO) | 8,841 | 9,282 | +441 pts | +4.99% |
All Ordinaries (XAO) | 9,004 | 9,459 | +455 pts | +4.81% |
The ASX 200 was the standout performer of the global reporting period. The XJO surged 441 points, or 4.99%, from 8,841 to a new all-time high of 9,282 as I type on 6 August 2026 (AEST). The All Ordinaries (XAO) gained 4.81% across the same period. This was the strongest fortnight for the Australian market in 2026, driven by a combination of global risk-on momentum and a powerful domestic catalyst: renewed Iran deal optimism that sent oil lower and gave the RBA cover to begin signalling the end of its tightening cycle.
Key drivers:
• Trump cancels Iran strike — On 2 August (AEST), President Trump announced via Truth Social that he had cancelled a planned military strike after receiving positive signals from Iran about deal “perimeters.” The ASX immediately surged on the news, gaining nearly 1.5% in a single session. This announcement was the single most powerful catalyst of the period for Australian equities, as lower oil directly reduces inflationary pressure and supports the RBA toward ending its tightening cycle.
• Materials sector at the vanguard — BHP and Rio Tinto both rallied strongly as iron ore held above US$100/tonne and copper stayed near multi-year highs. The materials sector added the largest contribution to index gains across the period. Glencore’s H1 2026 results, released on 5 August, showed an 86% surge in profits, providing further confidence in the global commodity cycle.
• Banks and healthcare also lifted — The big four banks advanced broadly as lower oil reduces inflation expectations and reduces pressure on the RBA to hike further. Healthcare staged a strong recovery: CSL, Telix Pharmaceuticals, and Ramsay Health Care all advanced as fund managers rotated into the sector following its worst year since 2008 in FY2026. This is consistent with the pattern of last year’s laggards becoming this year’s leaders.
• Gold miners volatile but positive — The gold sub-index (XGD) was volatile across the period, rallying as gold spot approached US$4,300/oz on Iran tensions, then softening as the deal signals emerged. Northern Star and Evolution Mining both delivered mid-single-digit gains for the period overall.
• RBA hold signals approaching — The June quarter CPI, released on 30 July (AEST), provided a slight positive surprise — inflation eased more than expected, driven by the decline in petrol prices seen in June before the oil re-escalation. This was enough to shift RBA commentary in a modestly dovish direction. Markets are now pricing a 55% probability of no further hikes, up from 30% two weeks ago. The 12 August RBA meeting will be closely watched.
Our take: Not much to add to the XJO commentary above as most of the drivers of our index has been like the US. We did outperform the US as we had lagged for most of the year and didn’t have the big tech sell-off impact locally. The macro environment continues to improve with inflation continuing to soften faster than the RBA/market anticipates, oil remaining relatively low and Australian households remaining resilient. Household spending for June came in at +0.8% for the month well ahead of the +0.2% exportations and following on from a strong +1.2% for May. Discretionary spending was +6.7% annually which is the strongest figure since June 2023. This showing that Australian household are still in a solid position and happy to spend. This comes from solid wages growth, high savings rates and relatively low unemployment.
This begets the question has the discretionary retail sector been sold off too heavily and will it outperform? This will be answered in the coming weeks as we enter our full year earnings season and hear from our retailers. We will also hear how the new financial year has begun and whether households have again trimmed spending or the trend continues. It’s probably the most important sector this earnings sector as it could provide the outperformance we need and boost for our index moving forward. Resources is obviously going to be the main driver of earnings growth this time around with overall earnings expected to grow 11-13% for FY25/26 on the XJO. Higher commodity prices will have benefitted our resources companies, but I will be keen to see how higher diesel prices have impacted bottom lines as well. Healthcare is expected to be the worst performing sector with CSL & COH guidance to be keenly watched. Overall investors should be relatively happy with the XJO over the last couple of weeks as it seems the rally, whilst lead by resources, has been also broad based. I will touch on the XJO earnings season next time around as apart from RIO we have had no one of note report earnings yet.


Where we started
Gold entered the period on the back foot. After surging to an all-time high of US$5,602/oz in January 2026, bullion had spent much of the following six months retreating as the Iran war — ironically the very event that first sent it soaring — drove inflation expectations and Fed hike fears, both of which are structural headwinds for non-yielding precious metals. By 16 July, gold had given back more than 27% from its peak, settling near US$4,064/oz.
What changed across this period is a powerful illustration of the multiple drivers now at work for gold simultaneously — some pulling it higher, some lower, and all of them switching direction rapidly as geopolitical news evolved day by day.
The key drivers of this period:
• Iran military re-escalation (bullish) — After Trump reinstated the Iranian naval blockade in mid-July and the US conducted fresh strikes on Iranian oil infrastructure on 13 July (AEST), gold’s safe-haven premium surged. COMEX futures hit a period peak of approximately US$4,350/oz on 6 August as investors sought protection from the conflict’s inflation consequences. The precious metal was once again doing what it does in wartime — acting as the ultimate store of value when conventional assets feel uncertain.
• Soft US payrolls (bullish) — The US June employment report, released on 2 July (AEST: 3 July), showed non-farm payrolls of just 57,000 — far below the 150,000 expected. On the first two trading sessions after this data, the XGD surged a combined +11% as bond yields fell, the US dollar weakened, and gold rallied nearly 3% in 48 hours. Lower rate expectations are directly positive for gold: the opportunity cost of holding a non-yielding asset falls as the prospect of competing interest income declines.
• Fed holds rates (mildly bullish) — The Federal Reserve’s decision to hold rates unchanged on 29 July (AEST: 30 July) removed the immediate threat of further rate rises eating into gold’s appeal. While Chair Warsh kept a hawkish tone, the hold itself was gold-positive at the margin.
• Central bank buying (structural support) — The World Gold Council reported that global central bank purchases in H1 2026 were the highest since 2011, with China, India, Turkey and several Central Asian nations all adding meaningfully to reserves. This structural demand provides a floor under the gold price regardless of short-term speculative swings and is one of the primary reasons golds has remained elevated even as the Iran safe-haven premium partially unwound.
• Reduced Inflation expectations (bullish) – The explosive move in gold in the last couple of days has been paired with US 10yr bond yields falling 15bps as inflation expectations cooled due to Iran tension simmered and ADP jobs figures coming in a little soft. If we see NFP jobs numbers miss expectations Friday night this could see this divergence continue. Remember a higher yield/USD is a headwind for gold.
How the index moved
The S&P/ASX All Ordinaries Gold Index (XGD) gained approximately 15% across the period — meaningfully outperforming the underlying gold price rise of 9.0% in USD terms, and even more so in absolute dollar terms for Australian investors once the AUD/USD move is factored in.
This outperformance is the hallmark of gold mining equities: they offer operational leverage to the metal’s price. A gold miner with an all-in sustaining cost (AISC) of A$2,500/oz that sells at A$6,200/oz (the approximate current AUD gold price) earns a margin of A$3,700/oz. A 9% rise in the gold price adds roughly $513 to that margin — a proportional improvement of approximately 12% on the earnings line, not 9%. That leverage effect is why gold stocks routinely move faster than the metal itself, in both directions.
Our take: After a very few rough months Gold is starting to shine again. I have remarked I expected inflation expectations to cool in the second half of the year and gold to benefit from that. This has started to play out and the XGD has responded rising 11% in the last two trading days. The technicals above will show gold has broken its downtrend and is now breaking out higher but will need the fundamentals above to continue to improve for gold to keep this rally going.
Many already hold positions in lots of gold companies in preparation for this but my picks in the producers’ space remain Northern Star (NST), Genisis (GMD), Perseus (PRU) & also add Ramelius (RMS) to that list. In the explorers/developers I really like Torque Metals (TOR) & Barton Gold (BGD). This list will continue to grow as the environment improves and more companies join the rally. Happy to be buying most gold stocks at current prices as I can see 20-50% higher prices if gold goes back to old highs in the next 6-12 months. I will note whilst most analysts have dropped year end gold prices, most remain well above current prices.
I hope you have all enjoyed another update. I did delay it almost a week so we could cover all the important tech earnings. I may try and put another update next week covering some of the ASX earnings. Regardless enjoying this rally in the market and affirmation of some of my market/thematic thesis. It’s very hard to stand your ground when so many factors go against you. I am always reminded that you can be right, but too early and that’s as good as being wrong because you are likely to have to exit before it plays out. I hope you all have a great weekend ahead and stay safe. Look forward to speaking with you all soon. Go Crows!


Comments